Strategic decisions rarely come with guaranteed outcomes. Every choice a business makes involves uncertainty, trade-offs, and consequences that branch out in multiple directions. Decision tree analysis is a structured method that helps organisations visualise those branches, assign probabilities to different outcomes, and calculate the expected value of each path before committing resources. It transforms complex, multi-layered decisions into a format that is clear, logical, and actionable.
Understanding the Structure of a Decision Tree
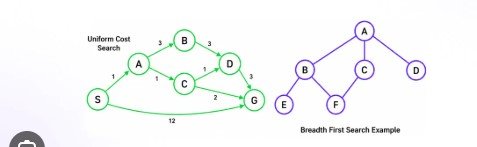
A decision tree is a diagram that maps out decisions and their possible consequences in a branching format, much like a tree growing outward from a single trunk. It consists of three main elements:
Decision Nodes: Represented by squares, these are points where a choice must be made. The branches extending from a decision node represent the available options.
Chance Nodes: Represented by circles, these indicate points where an outcome depends on probability rather than a direct choice. Each branch from a chance node is assigned a likelihood, and all probabilities from a single node must add up to 1.
End Nodes: Also called terminal nodes or leaves, these are the final outcomes at the end of each branch. They show the result of following a particular sequence of decisions and events.
Reading a decision tree from left to right follows the chronological order of choices and outcomes. The process of analysing it, however, works from right to left, a technique called backward induction. This involves calculating the expected value at each chance node and working backwards to determine which decision path produces the most favourable overall result.
How to Calculate Expected Value in a Decision Tree
Expected value is the core metric in decision tree analysis. It represents the average outcome of a decision when all possible scenarios are weighted by their probability of occurring.
The formula is straightforward: multiply the value of each outcome by its probability, then sum those products across all branches from a given chance node.
For example, consider a company deciding whether to launch a new product. If launched, there is a 60% chance of strong market reception, generating a net gain of 500,000 rupees, and a 40% chance of poor reception resulting in a net loss of 200,000 rupees. The expected value of launching would be calculated as follows: (0.60 x 500,000) + (0.40 x -200,000) = 300,000 – 80,000 = 220,000 rupees.
If the alternative, which is not launching, carries zero gain and zero loss, then the launch option holds a higher expected value and would be the preferred choice under this framework.
This approach removes the bias of focusing only on best-case or worst-case scenarios and instead forces a balanced assessment of all realistic possibilities.
Practical Applications Across Business Functions
Decision tree analysis is not limited to financial forecasting. It is applied across a wide range of business functions where structured thinking about outcomes is necessary.
In project management, decision trees help teams evaluate whether to build in-house or outsource a function, factoring in cost, time, and risk of failure at each stage. In supply chain management, they assist in choosing between multiple suppliers when delivery reliability and pricing vary. In marketing, they guide budget allocation decisions by comparing the expected returns of different campaign strategies.
Healthcare and pharmaceutical sectors use decision trees extensively for clinical trial planning and treatment pathway decisions, where costs and outcome probabilities must be mapped with precision.
For professionals looking to apply these tools in industry, structured training is a significant advantage. Those enrolled in business analyst classes in Chennai develop hands-on competency in analytical frameworks, including decision tree modelling, giving them the skills to support strategic planning across sectors.
Limitations to Keep in Mind
Decision tree analysis is a powerful tool, but it works best when its limitations are acknowledged.
First, the accuracy of the analysis depends entirely on the quality of the probability estimates and outcome values used as inputs. If these are based on poor data or optimistic assumptions, the resulting decision will reflect those flaws.
Second, decision trees can become very complex when multiple sequential decisions are involved. A tree with many branches and levels can become difficult to interpret and maintain, requiring software tools rather than manual calculation.
Third, the model assumes that all relevant outcomes can be identified and quantified. In practice, some risks are difficult to measure precisely, and qualitative factors such as brand reputation or employee morale may not translate neatly into numerical values.
Understanding these boundaries helps analysts use the tool more responsibly. Courses covering strategic decision frameworks, including business analyst classes in Chennai, typically address both the strengths and constraints of methods like decision trees to ensure graduates apply them with appropriate judgement.
Conclusion
Decision tree analysis brings clarity to situations where multiple paths, probabilities, and costs interact. By mapping outcomes visually and applying expected value calculations, organisations can move from uncertain intuition to structured reasoning. It does not eliminate risk, but it ensures that decisions are made with full awareness of what each choice involves. For any professional working at the intersection of data, strategy, and business operations, this is one of the most practical analytical tools available.