Raw data is rarely ready for analysis the moment it is collected. It arrives with missing values, inconsistent formats, duplicated records, outliers, and schema changes that break downstream dashboards and models. A data wrangling pipeline solves this by turning cleaning into a repeatable, automated workflow rather than a one-time manual task. When teams standardise these steps, they reduce errors, speed up delivery, and make analytics more trustworthy. This is also why many learners in data science classes in Bangalore spend significant time understanding how to move from “messy inputs” to “analysis-ready datasets” with consistent rules.
What a Data Wrangling Pipeline Really Is
A data wrangling pipeline is an ordered set of automated transformations that converts raw data into curated, usable datasets. It typically runs on a schedule (hourly, daily) or triggers when new data lands. Unlike ad-hoc cleaning in a notebook, a pipeline is designed for reliability: it produces the same output given the same input, captures logs for auditing, and includes validation checks to catch issues early.
A practical way to think about it is like a manufacturing line:
- Input: raw data from apps, CRMs, sensors, forms, or external sources
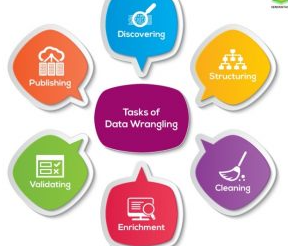
- Process: profiling, cleaning, standardisation, enrichment, and validation
- Output: clean tables/files that analytics, BI, and ML can safely consume
Core Stages in a Modern Wrangling Pipeline
Below is a common set of stages used in real projects. Your pipeline may combine or reorder them, but the logic is similar.
1) Ingestion and schema handling
First, ingest data from source systems into a landing area (data lake, warehouse, or object storage). Capture metadata such as ingestion time, file name, and source system. A key best practice is to handle schema changes intentionally:
- Detect new or missing columns
- Apply schema evolution rules (allow, warn, or fail)
- Store schema versions so changes are traceable
2) Data profiling and anomaly detection
Before transforming, profile the dataset:
- Null percentage per column
- Distinct values and frequency distributions
- Range checks for numeric columns
- Pattern checks for IDs, emails, dates, and phone numbers
Profiling helps you decide which cleaning rules are required and sets a baseline for monitoring. For example, if “country_code” suddenly becomes mostly null, the pipeline should flag it.
3) Cleaning and standardisation
This stage applies the most common wrangling rules:
- Missing values: impute, default, or quarantine records
- Duplicates: define dedup keys and keep the latest record using timestamps
- Type casting: convert strings to numbers/dates with strict parsing rules
- Formatting: standardise case, trim spaces, normalise currency symbols, and unify date formats
- Outliers: cap, remove, or route to an exceptions table depending on the business context
For example, if an e-commerce dataset contains “₹1,299”, “1299”, and “1,299 INR”, standardisation converts these into a single numeric “1299” and stores currency separately.
4) Enrichment and business rules
Cleaning alone may not be enough. Enrichment adds context:
- Joining reference/master data (city mappings, product catalogues, employee tables)
- Deriving features (customer tenure, session duration, churn flags)
- Applying business logic (valid status transitions, region rules, tax rules)
This is where pipelines become domain-aware. Learners often practise these transformations in projects within data science classes in Bangalore, because business rules vary widely across industries.
5) Validation, tests, and publishing curated outputs
Before publishing the cleaned dataset, validate it:
- Row count checks (large drops/spikes should fail the run)
- Uniqueness checks on primary keys
- Null thresholds for critical fields
- Referential integrity checks for joins
- Freshness checks (data must be updated within an expected window)
If validation passes, publish to curated tables (often called “silver/gold” layers). If it fails, route to an alerting workflow and keep the last known good dataset available so reporting does not break.
Tools and Architecture Patterns That Work
A pipeline is not just “some scripts.” It is typically a combination of tools and conventions:
- Transformation engines: Python (pandas), SQL, Spark
- Orchestration: Airflow, Prefect, Dagster, cloud schedulers
- Data quality frameworks: Great Expectations, Deequ-like rule checks, custom SQL tests
- Storage and formats: Parquet, Delta/Iceberg/Hudi tables for reliability and versioning
- Observability: logs, metrics, and alerts (run duration, error rate, null rate changes)
A helpful design principle is to keep each step idempotent (safe to re-run) and modular (each transformation has a single purpose). This makes debugging faster and reduces the chance that a small change causes hidden side effects.
Practical Best Practices for Reliable Wrangling
To keep pipelines stable as data grows and changes:
- Version your transformations (code + configuration) and use peer review.
- Treat data quality as a contract: define what “valid data” means and enforce it automatically.
- Maintain an exceptions table instead of silently dropping bad records.
- Track lineage so you can answer “Which source fields created this metric?”
- Monitor drift (null spikes, distribution shifts, unusual category values).
- Document assumptions in simple terms so analysts and stakeholders understand the rules.
Conclusion
Data wrangling pipelines turn raw, inconsistent inputs into dependable datasets through an automated sequence of profiling, cleaning, standardisation, enrichment, and validation. The payoff is practical: fewer downstream failures, faster analytics delivery, and more confidence in reports and models. If you are building real-world skills—whether on the job or through data science classes in Bangalore—understanding these pipeline stages and best practices is one of the most direct ways to improve the quality and reliability of any data-driven system.